Custom Modulation
The graph view displays several different representations of the generated waveform.
The following graphs are available at the bottom of the Waveform screen.
Click Generate from the tool bar to generate an I/Q waveform to plot and display a graph using the current channel configuration. Changes to the channel configuration do not update the graph until you re-generate the waveform. You can also use the colored indicators on the right side of the graph to toggle on/off individual plots.
The drop-down menu selections described below allow you to customize the display of generated IQ data on the graph.
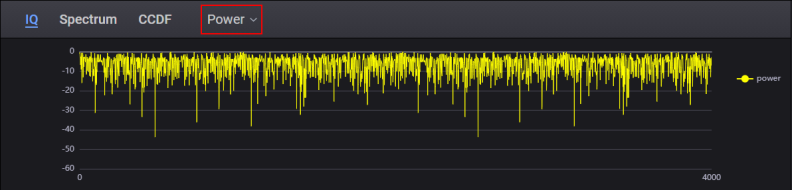
The Power menu selection displays the overall IQ waveform power.
Figure 1: IQ set to Power
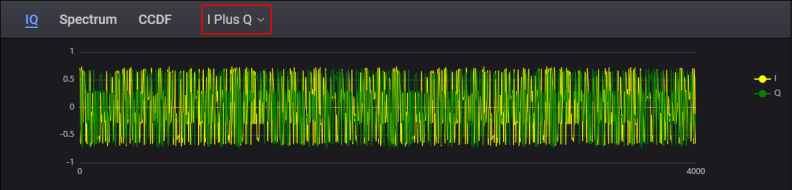
The I Plus Q menu selection displays I + Q combined power.
Figure 2: IQ set to I Plus Q
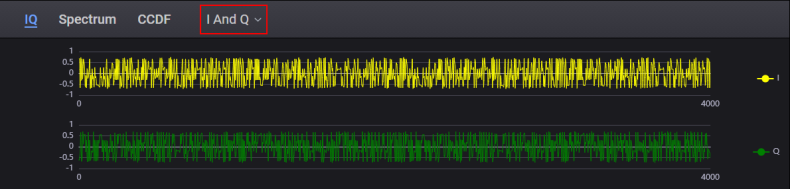
The I And Q menu selection displays I and Q power separately.
Figure 3: IQ set to I And Q
Click Generate from the tool bar to generate an I/Q waveform to plot and display a graph using the current channel configuration. Changes to the channel configuration do not update the graph until you re-generate the waveform. You can also use the colored indicators on the right side of the graph to toggle on/off individual plots.
Figure 4: Spectrum
![]()
The CCDF graph displays the probability (in percentage) that the generated waveform's calculated peak-to-average power ratio (measured in dB) is greater than or equal to a specified level. The table to the left of the CCDF plot displays the calculated peak-to-average values for the current waveform. For additional information, see Understanding CCDF Curves.
Click Generate from the tool bar to generate an I/Q waveform to plot and display a graph using the current channel configuration. Changes to the channel configuration do not update the graph until you re-generate the waveform. You can also use the colored indicators on the right side of the graph to toggle on/off individual plots.
Figure 5: CCDF Curve
![]()
The controls described below allow you to customize the display of Gaussian data, reference data, and generated waveform data on the CCDF graph. The graph's initial state shows only the Gaussian curve (blue) until you generate a waveform.
The Reference checkbox shows/hides the reference curve (pink) that was set with Acquire Reference.
The Acquire Reference button sets the current curve (yellow) as the new reference curve (pink).
The Burst menu selection calculates the CCDF curve based on the generated I/Q waveform, excluding the off power period.
The Waveform menu selection calculates the CCDF curve based on entire generated I/Q waveform.